In part 1 of this article series (here), I laid out a few guiding principles regarding Finite Impulse Response (FIR) filters. Here’s a quick review:
1) With FIR filters I can have very steep LP and HP filters, such as might be used in a crossover network, that have linear group delay (same delay for all frequencies).
2) The magnitude and phase response of a FIR filter can be adjusted independently. In an Infinite Impulse Response (IIR) filter they are interdependent – you can’t change one without changing the other.
3) WAV impulse responses by definition are FIR filters, since they are fixed in length and cannot (theoretically) decay for infinity. Any IR you measured can potentially be used as a filter.
So, let’s create some FIRs.
Creating The FIR Filter
I created my FIR filters in software, using the freeware rePhase to define a high-pass filter (HPF) and low-pass filter (LPF) based on a few input variables (Figure 1). You’ll want to add rePhase to your toy box for investigating FIRs. (I’ll show some other FIR-creation tools in future installments of this series.)
I’ll create a 1 kHz brickwall HP filter. FIR filters are defined by the number of “taps.” This is a way of specifying the length of the impulse response. The number of taps is equal to the number of samples.

Figure 1 – FIR filters generated with rePhase.
Basically, the more taps, the more samples, the longer the time length, and the greater the precision. The greater the precision, the greater the “sharpness” that can be attained in the frequency domain. Just as you need a long time window to resolve low frequencies when performing acoustical measurements, you need a lot of taps (long IRs) for detailed low frequency FIR filters.
Let me demonstrate. Figure 2 shows the response of a 60 tap, 1 kHz HPF, the response of a 600 tap HPF, and the response of a 6000 tap HPF. Clearly, the 6000 tap filter can be described as “brickwall.”
That’s the one we want, right? This is audio, and you never get something for nothing.

Figure 2 – At the top we see a 60 tap FIR HPF. Note the lack of sharpness due to the small tap size. Next, adding more taps (more samples or a longer time length) creates a sharper filter, and then at the bottom, we have a 6000 tap filter that is 136 ms in time duration, with latency of 1/2 of the length (68 ms).
The latency through an FIR is one-half the number of taps, so the signal through this filter will be delayed by 3000 samples. At 44.1 kHz, that’s a bit over 60 milliseconds (ms). While that might be acceptable in a home playback system, it might as well be next week for live sound. I’m going to stay with this to illustrate the concept, but in the real world we’d have to give back some of the precision to reduce the latency.

Figure 3 – The FIR generation and export settings in rePhase.
I created a 1 kHz LP filter in the same manner. Since these brickwall filters essentially do not overlap, I don’t have to worry about how they interact. Filter interaction is a main concern for analog and IIR digital filters.
These are “brickwall” filters that produce no frequency-dependent delay. Note how wacky the phase response gets in the stop band. That’s because the magnitude response is down about 80 dB.
If there is no magnitude response (i.e., no signal output from the filter), then the phase is meaningless and looks like garbage.
rePhase allows the filters to be saved in multiple formats, including WAV files (Figure 3). They can be convolved with any audio signal in real time or as a post process.

Figure 4 – The software GUI for the miniDSP OpenDRC 2×2.
We’ll need some hardware to do the convolution in real time. I saved them as 32-bit IEEE-754 mono .bin files, and dropped them into a miniDSP OpenDRC 2×2 to allow measurement and listening (Figure 4). This DSP can handle FIRs up to 6144 taps, so the 6k tap filter just makes it.
This is a very simple FIR, for illustrative purposes. It can actually have a very detailed shape, including corrective equalization filters. One FIR filter can replace a whole bank of parametric EQ filters along with HP and LP filters. It’s like having one super-duper filter rather than a bunch of simple ones.
Analog Filter Comparison
For comparison, I also generated a 1 kHz, 4th-order Linkwitz-Riley filter pair. These are typical of the crossover filters implemented by most DSPs.
These are IIR filters similar to what are produced by analog processors. I showed the transfer functions of these filters (and their sum) in part 1, so I won’t include them here.
While the magnitude response of the summed filters is flat, the phase response is not linear. The filters have produced a frequency-dependent phase shift in the response.
Applied To A Loudspeaker System
What good is a filter unless you use it to filter something? An interesting way to experiment with crossover networks is to use two identical loudspeakers. Since they’re the same, the response of the filters can be easily observed.
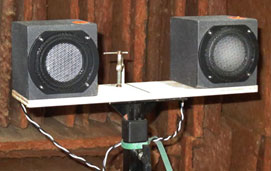
One will be the LF device and one will be the HF device (Figure 5). These are small cube loudspeakers that I built to use for classroom demos.
The responses of these two devices have been matched using the parametric EQ filter blocks in the OpenDRC DSP. The parametric equalizer settings were determined using the EQ module of Room EQ Wizard (REW), a freeware measurement program.

Figure 5 – My little traveling cubes.
REW calculates the filters required to correct the loudspeakers response, and saves them in a format that can be directly imported by the DSP. This saves the “grunt work” required to manually adjust the filters until the response is flat.
Note that this is not “auto EQ.” I properly collected and windowed the axial response of each loudspeaker, using 1/12th-octave smoothing to get ride of some of the detail. I then let REW do a curve-fit between 100 Hz and 10 kHz, and give me the list of the filters required to flatten it.
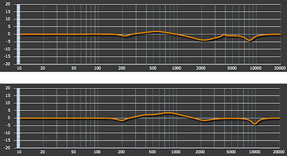
When satisfied, I imported this list into the DSP. The responses are shown in Figure 6. Note that they are different, because the loudspeakers are unavoidably different.

Figure 6 – The correction curve (IIR parametric filter set) for each cube loudspeaker.
There’s a good lesson there for those that think they can do high resolution equalization on multiple devices by measuring one of them, but that’s a different article.
Figure 7 shows the full-range overlaid responses of the two loudspeakers with the IIR parametric filters applied, followed by the overlaid responses of the two loudspeakers with the FIR crossover filters applied, and then the measured full-range response (both magnitude and phase) with all filters applied, and finally, the measured response LP, HP and summed responses using the LR24 crossover.

Figure 7 – At the top (1), we see the frequency response magnitude of each cube loudspeaker, post equalization. Next (2), a FIR filter is applied to each box. Note the minimal overlap of their responses due to the steep slopes. Following that (3), we see the transfer function of the summed axial response as measured in the far-field. At the bottom (4), we see the summed response using a Linkwitz-Riley 24 dB/oct crossover network. The magnitude is exactly the same as the FIR response, but the phase response shows the expected phase shift caused by the IIR filters.
Note that the magnitude responses are the same for the LR24 and brickwall crossovers. The difference will be in the phase response, and the polar response of the pair.
Proof In The Polars
I spaced the two loudspeakers 1 wavelength at 1 kHz (about 1.1 feet), shown in Figure 8.

Figure 8 – A horizontal polar was measured on the two devices. They were offset 1 wavelength at 1 kHz.
This configuration should produce a polar that looks like a shamrock on St. Patrick’s day, since the loudspeakers will be 180 degrees out-of-phase at 1 kHz at several angles around the polar, and in-phase at other angles. I used this configuration to evaluate the polar response at the crossover frequency of 1 kHz.
On the left in Figure 9, we see the polar response at crossover for the Linkwitz-Riley crossover network. The response lobes, because both transducers are “talking” in the crossover region. Since they are offset physically, lobing is unavoidable. As expected, the response resembles a four-leaf clover.
On the right is the polar response at crossover for the FIR crossover network. The lobing is eliminated because the offset transducers are not overlapping in frequency.

Figure 9 – The polar response at 1 kHz (1/3-oct, 5-degree angular resolution) using the LR24 crossover (A) and the linear phase brickwall crossover (B).
The transducers in multi-way loudspeakers have always been interdependent, and lobing has always been a big issue. The use of linear phase brickwall filters can eliminate lobing by allowing the passbands to behave independently. Given the axial transfer function and polar response, it is impossible to determine that this is a two-way system with offset transducers – pretty amazing.
The Whole Story
While it sounds like FIRs have brought us to a new level of loudspeaker performance, I must point out that multi-way loudspeakers that do not exhibit lobing through their crossover region have existed for decades and can be created without brickwall linear phase FIR filters.
Coaxial and co-entrant designs accomplish this by the physical placement of the transducers. Yes, FIRs can provide steep slopes at crossover, but if the loudspeaker produces sufficient SPL without them, there may be no benefit.
My point? Don’t be a “FIR snob” and turn up your nose at loudspeaker designs that use IIR and analog filters. I’d always take a well-designed multi-way loudspeaker with passive crossover over a complicated FIR-driven active system, IF the passive system met the needs of the application. Less can be better.
It’s often true that the major benefit of advancements in digital technology is that it gives us more ways to salvage bad designs and practices. FIR filters can often improve the performance of marginal loudspeaker designs. But when FIR technology is combined with excellent electro-acoustic design practices, there is indeed the potential to reach new levels of performance. While not a panacea, FIR filters are a nice tool to have in the toolbox.


